It was one of the few places on the planet that remained unmapped and unexplored, but now Mount Mabu has started to yield its secrets to the world.Check out the whole story.
Until a few years ago this giant forest in the mountainous north of Mozambique was known only to local villagers; it did not feature on maps nor, it is believed, in scientific collections or literature. But after "finding" the forest on a Google Earth internet map, a British-led team of scientists has returned from what is thought to be the first full-scale expedition into the canopy. Below the trees, which rise 45m above the ground, they discovered land filled with astonishingly rich biodiversity. It was one of the few places on the planet that remained unmapped and unexplored, but now Mount Mabu has started to yield its secrets to the world.
Sunday, December 21, 2008
Google Earth used to "discover lost Eden" in Africa
In a welcome change to the recent rush of stories on the theme of "terrorists use Google Earth" (I'm still not sure of the ongoing fascination with that theme versus "terrorists use cell phones" or "terrorists use boats"), there's a story in today's Observer in the UK about how Google Earth was used to "discover a lost Eden" in Africa:
Thursday, December 18, 2008
Smallworld's 20th birthday
It was brought to my attention the other day that we have just passed the 20th anniversary of the founding of Smallworld (December 3rd 1988 was its first day). Many readers of my blog these days may not be familiar with Smallworld, which is now part of GE, who acquired us in 2000. I joined Smallworld in 1992 in the UK when it was still a fairly small startup (about 30 people or so I think), was the first person to move from the UK to the US when we started here in 1993 (working with our sales guy Steve Bonifas), and I left in 2002. Smallworld grew to become the global market leader in GIS for utilities and communications companies, and almost certainly still holds that title today, depending on which market survey you believe. It certainly remains very strong in the high end of the utility and telecom market.
Smallworld really revolutionized the GIS market back in the early nineties, introducing several radical new ideas, and several ESRI insiders have since told me that ArcInfo 8.0 (now ArcGIS) was developed in order to respond to Smallworld's impact on the market - it clearly copied a number of ideas from Smallworld, as well as missing a number of important aspects too.
Some of the key innovations introduced by Smallworld at the beginning of the nineties included:
So anyway, I'd like to finish by recognizing the 10 founders of Smallworld, and congratulate them for building such a ground-breaking product and great company, and thank them for all the good times. The founders were Dick Newell, Tim Cadman, Richard Green, David Theriault, Mike Williamson, Hugh Fingland, Arthur Chance, Mark Easterfield, Cees Van Der Leeden, and Klas Lindgren. (Slightly belated) Happy Birthday!!
Smallworld really revolutionized the GIS market back in the early nineties, introducing several radical new ideas, and several ESRI insiders have since told me that ArcInfo 8.0 (now ArcGIS) was developed in order to respond to Smallworld's impact on the market - it clearly copied a number of ideas from Smallworld, as well as missing a number of important aspects too.
Some of the key innovations introduced by Smallworld at the beginning of the nineties included:
- Handling of long transactions using a new technique called version management (which became an industry standard approach some ten years later, being adopted in some form by ESRI, Intergraph and Oracle, among others)
- Outstanding performance and scalability, with the ability to interactively pan and zoom around very large continuous databases, and immediately edit features without having to extract anything, which was revolutionary at the time (most comparable systems required you to check out data from a database into a local file, which typically took minutes to do).
- Both the preceding features were due to the Version Managed Data Store (VMDS), a specialized database management system developed by Smallworld (specifically by Mark Easterfield) which was highly optimized for long transactions and spatial data - interestingly the high performance characteristics came from an elegant caching approach that was specific to the way that long transactions were handled. You can read more about this in a white paper called GIS Databases are Different, which I co-wrote with Dick Newell. There's an interesting debate of course on the extent to which the title of this paper is true - it is in some ways but not in others, but that could take up several posts in its own right so I won't go there just now! In the late nineties as use of mainstream relational databases for spatial data became more common, VMDS was really a two-edged sword from a sales perspective. The market didn't like the idea of a "proprietary" database, even though in many ways it was and still is a superior technology for interactive graphical applications in a long transaction environment.
- An extraordinarily flexible and productive development environment, based on Smallworld's own object-oriented language called Magik (initially developed by Arthur Chance, with significant contributions from Nicola Terry), which was way ahead of its time and very similar to Python, which has of course become very popular in the last few years and recognized for being an extremely productive environment. Smallworld was a pioneer in the use of object-orientation for large scale systems. The system had a unique approach which made almost any aspect of the system incredibly customizable, yet in a way which minimized support and upgrade issues. Getting into detail on that is beyond the scope of this post but maybe that's another item I'll return to in future.
- A data model based on spatial attributes rather than spatial objects. This is one of the really important features that ESRI didn't get into ArcGIS, which is still based around the idea that a feature is a point, line or polygon (with a few minor extensions, but still the concept is that a feature has a specific spatial type). In Smallworld, an object (feature) could have any number of spatial attributes, each of which could be a point, line or area, which is a much more flexible and powerful approach in many applications. This is something that you really have to design into your system from the beginning, as it fundamentally changes many aspects of the system from data modeling through to many aspects of the user interface, so I suspect that it is unlikely that ESRI will ever adopt this model at this point. I talk about some examples of how this model is useful in the technical paper AM/FM Data Modeling for Utilities, as well as discussing some other modeling constructs that were unique to Smallworld at the time, like multiple worlds.
- Integration of raster and vector data in a common database, with features for automated line following to help with "heads up digitizing" for data capture from (scanned) paper maps. Smallworld never did support traditional digitizing tablets, which were the primary means of data conversion back then, and we fought quite a lot of battles in RFPs explaining why we didn't support this often "mandatory" requirement.
- An integrated CASE tool for graphical design of your data model, which was itself version managed (the CASE tool was actually just a specialized Smallworld GIS application). Another feature of Smallworld was that you could modify the data model of a production database just within an individual version, which was incredibly powerful for being able to test changes without impacting users of the system, and then just apply them to all versions once you had tested everything. There is also a technical paper on the CASE tool.
So anyway, I'd like to finish by recognizing the 10 founders of Smallworld, and congratulate them for building such a ground-breaking product and great company, and thank them for all the good times. The founders were Dick Newell, Tim Cadman, Richard Green, David Theriault, Mike Williamson, Hugh Fingland, Arthur Chance, Mark Easterfield, Cees Van Der Leeden, and Klas Lindgren. (Slightly belated) Happy Birthday!!
Friday, November 14, 2008
Upcoming presentations - GeoAlberta and Angel Capital Summit
Apologies for the lack of posting recently, lots going on! Just a quick one to say that I will be doing a couple of conference presentations next week. I'll be at GeoAlberta in Edmonton, where I'm presenting on Tuesday afternoon on the subject of "Applications based on Future Location", and on Wednesday lunchtime I'm on an industry panel with a group of the usual suspects - Geoff Zeiss from Autodesk, Alex Miller from ESRI, Kevin Aide from Intergraph and Xavier Lopez from Oracle.
On Friday I'll be presenting at the Angel Capital Summit in Denver, on why Spatial Networking is the next big thing that investors should put their money into :). I did a practice pitch this week and got some good feedback from the reviewers, so am looking forward to that.
On Friday I'll be presenting at the Angel Capital Summit in Denver, on why Spatial Networking is the next big thing that investors should put their money into :). I did a practice pitch this week and got some good feedback from the reviewers, so am looking forward to that.
Monday, October 13, 2008
Statements that come back to haunt you
Just read this article in Forbes, which says:
Community input isn't the answer to all data creation and maintenance problems, but it provides an excellent solution in a number of areas already, and the extent of its applicability will increase rapidly.
"I laugh when I hear that you can make a map by community input alone," says Tele Atlas founder De Taeye. He says that if tens of thousands of users travel a road without complaining, then Tele Atlas can be fairly certain that its map of the road is correct.The first statement is demonstrably false already (see my earlier post about Oxford University and OpenStreetMap for just one example). But then it's a little bizarre that he follows that up by saying that the reason they know that their data is correct is through (lack of) feedback from the community. I've done my share of interviews and it's quite possible that these two statements were taken out of context, but it's an odd juxtaposition. I'm sure the owners of Encyclopedia Britannica laughed at the notion that you could produce a comparable online encyclopedia by community input alone, but they aren't laughing any more and are even moving to accommodate community input, as are most of the main mapping data providers of course (including Tele Atlas).
Community input isn't the answer to all data creation and maintenance problems, but it provides an excellent solution in a number of areas already, and the extent of its applicability will increase rapidly.
Sunday, October 12, 2008
New whereyougonnabe release, including support for Fire Eagle and GeoRSS
This week we added quite a number of new capabilities to whereyougonnabe, including support for Fire Eagle and GeoRSS, substantially expanded help documentation, improved synchronization capabilities, support for SMS, and exclusive use of Google Local Search in the whereyougonnabe browser application, as discussed previously (having introduced this approach for external sync in the previous release). For more detail on the new functionality from a user perspective see the whereyougonnabe blog - I'll touch on aspects of this here, but also discuss a little more of the technical background.
As most readers of this blog probably know, Fire Eagle is a service from Yahoo that is essentially an independent location broker supported by a number of applications which use location. You can sign up for free, and authorize applications to update and/or read your location. In the case of whereyougonnabe, we update your location automatically based on the plans you have told us about in advance. So for example, if you are using our Tripit interface, just by forwarding a single email with your itinerary, we will update your location throughout your trip, indicating the airports and cities you are in.
I really like our new RSS feed capability, which lets you easily view data from whereyougonnabe from outside the application, for example in web home pages like My Yahoo or iGoogle. The following is an example:
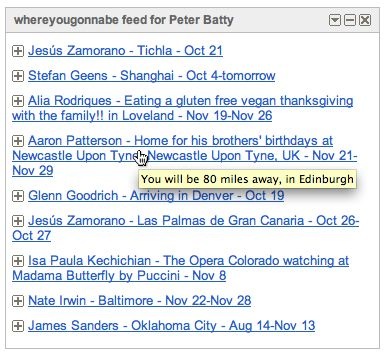
The content of the feed uses a similar algorithm to the one we use for WYTV, with a somewhat random mix of activities from your friends which will close to you, and some which won't. While a major focus of the system is of course identifying opportunities to meet friends, another important aspect is just keeping in touch with your friends. This is similar to using Facebook status or Twitter, but we have more information about an activity, including its location and time, which lets us select "interesting" items more effectively (for example, activities further from home will probably be more interesting than those close to home, in general).
You can click through on any element in the RSS feed to see more details in whereyougonnabe:
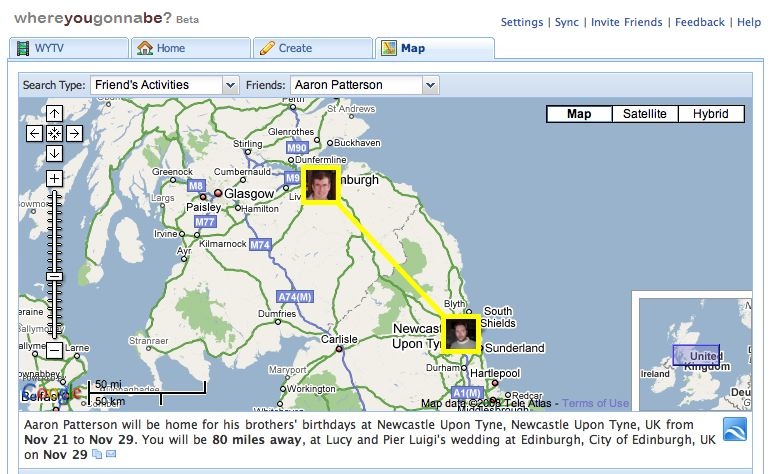
This ability to link directly to a specific activity in whereyougonnabe is new with this new release. We now use these links in various places where you see data outside whereyougonnabe, including Facebook status and newsfeeds, Twitter messages, and iCal feeds. People will only be able to see the details if they are authorized to do so (i.e. typically if they are your friend on Facebook). We see this as an important development in terms of integration with other systems, and in encouraging people to use whereyougonnabe more often.
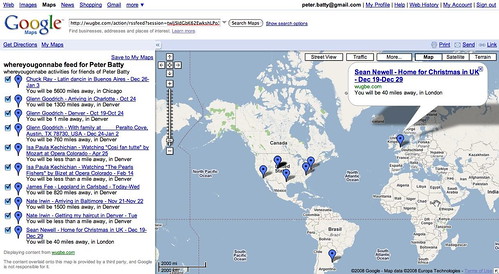
As I mentioned above, the RSS feed is actually a GeoRSS feed, so you can display elements on a map in software which supports GeoRSS, such as Google Maps (just copy the feed URL into the search box):
Lastly, we have made various enhancements to the synchronization capabilities, including a sync on demand capability which gives you feedback on what is happening with the sync, which is helpful in confirming that it is working as expected, and/or diagnosing any problems.
There are several other functional improvements in the release too - as I mentioned, you can read more about these at the whereyougonnabe blog.
As most readers of this blog probably know, Fire Eagle is a service from Yahoo that is essentially an independent location broker supported by a number of applications which use location. You can sign up for free, and authorize applications to update and/or read your location. In the case of whereyougonnabe, we update your location automatically based on the plans you have told us about in advance. So for example, if you are using our Tripit interface, just by forwarding a single email with your itinerary, we will update your location throughout your trip, indicating the airports and cities you are in.
I really like our new RSS feed capability, which lets you easily view data from whereyougonnabe from outside the application, for example in web home pages like My Yahoo or iGoogle. The following is an example:
The content of the feed uses a similar algorithm to the one we use for WYTV, with a somewhat random mix of activities from your friends which will close to you, and some which won't. While a major focus of the system is of course identifying opportunities to meet friends, another important aspect is just keeping in touch with your friends. This is similar to using Facebook status or Twitter, but we have more information about an activity, including its location and time, which lets us select "interesting" items more effectively (for example, activities further from home will probably be more interesting than those close to home, in general).
You can click through on any element in the RSS feed to see more details in whereyougonnabe:
This ability to link directly to a specific activity in whereyougonnabe is new with this new release. We now use these links in various places where you see data outside whereyougonnabe, including Facebook status and newsfeeds, Twitter messages, and iCal feeds. People will only be able to see the details if they are authorized to do so (i.e. typically if they are your friend on Facebook). We see this as an important development in terms of integration with other systems, and in encouraging people to use whereyougonnabe more often.
As I mentioned above, the RSS feed is actually a GeoRSS feed, so you can display elements on a map in software which supports GeoRSS, such as Google Maps (just copy the feed URL into the search box):
Lastly, we have made various enhancements to the synchronization capabilities, including a sync on demand capability which gives you feedback on what is happening with the sync, which is helpful in confirming that it is working as expected, and/or diagnosing any problems.
There are several other functional improvements in the release too - as I mentioned, you can read more about these at the whereyougonnabe blog.
Wednesday, October 8, 2008
OpenStreetMap mapping party in Denver
Just a quick note to say that there will be a mapping party in Denver the weekend of October 18-19, following on from the first one we had back in July. Richard Weait from Cloudmade will be here to coordinate things, and I'll be hosting it at my loft in downtown Denver, as I did last time. I think we'll be starting at 1pm each day, and migrating to the Wynkoop Brewing Company downstairs at around 5pm.
If you haven't been to a mapping party before (or if you have!) I encourage you to come along. Last time we had a decent turnout, about 5 or 6 people each day, and we made some good progress on mapping downtown Denver.
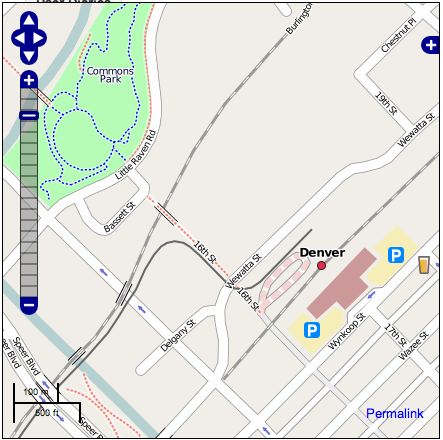
The screen shot above shows some details that you won't find in Google or Microsoft maps of Denver, including various footpaths and the light rail line. Click here for a live link. I hope we will finish up a pretty complete map of the downtown area at this level of detail over that weekend. And of course if you have other interests like cycle paths, etc, you are free to work on whatever you like! If you have any questions let me know. More information will be posted at Upcoming shortly.
If you haven't been to a mapping party before (or if you have!) I encourage you to come along. Last time we had a decent turnout, about 5 or 6 people each day, and we made some good progress on mapping downtown Denver.
The screen shot above shows some details that you won't find in Google or Microsoft maps of Denver, including various footpaths and the light rail line. Click here for a live link. I hope we will finish up a pretty complete map of the downtown area at this level of detail over that weekend. And of course if you have other interests like cycle paths, etc, you are free to work on whatever you like! If you have any questions let me know. More information will be posted at Upcoming shortly.
Which city is this airport in? (An exercise in using geonames)
Today I spent some time working updating on updating the airport dataset we use with whereyougonnabe. I thought that it was an interesting process to iteratively come up with a reasonable algorithm for what I needed to do, so I thought I would explain it here. I'd be interested in any feedback both on improvements to the technical approach (or entirely different approaches), and also on what the "right answer" should be from a user perspective in some of the questionable cases I mention.
As I've mentioned previously, we use Google Local Search for geocoding in general, but in our experience this really doesn't work well for geocoding airports based on the three letter airport codes. When we import travel itineraries from Tripit, the three letter airport codes are the best way to unambiguously identify which airports you will be in, so we need a reliable way of geocoding those.
We have been using the geonames dataset to do this, a rich open source database, which includes cities, airports and other points of interest from around the world. There are about 6.6 million points in the whole dataset, of which about 23000 are airports, and of those about 3500 have three letter IATA codes. Coverage seems to be fairly complete, but we have found a few airports with IATA codes missing - Victoria, BC, is one (code YYJ), and today I found that Knoxville was missing its code (TYS). I updated Victoria in the source data online, and it shows up in the online map but for some reason still does not appear in the downloaded data, I have that on my list of things to look into.
In general, the geonames airport records usually have null data in the city field. This is something I really wanted for each airport, so I can show a short high level description like "departing from Denver" or "arriving in London". Often the city name is included in the airport name, but not always - for example, the main airport in Las Vegas is just named "McCarran International Airport", which would not be an immediately obvious location to many people. And even where the city is included, the name is often longer than I want for a short description, for example "Ronald Reagan Washington National Airport".
For our first quick pass at populating the city for each airport, we used the Yahoo geocoding service, as it has a reverse geocoding function (and we thought we would try it out). You just pass this a coordinate and it gives you a city name (and other data) back. This is the data we are using in the live version of whereyougonnabe today. However, I noticed that this doesn't always give me what I would like - for example, it tells me that London Heathrow airport is in Ashford, and Vancouver airport is in Richmond. This may be technically correct (or not, I don't know for sure), but I'd really find it more useful to see the main city nearby in my high level description - so it will say I am arriving in London or Vancouver, in these two examples.
One nice aspect of the geonames dataset is that it includes the population of (many) cities, so we can use this in determining which is the largest nearby city. So in my first pass at solving the problem, I ran a PostGIS query for each airport to look for "large" cities nearby. Somewhat arbitrarily I initially specified population thresholds of 250000, 100000 and 0, and distance thresholds of 5, 25 and 50 miles. I would first search for cities with population > 250000 within 5 miles, and if I didn't find any I would extend to 25 miles and then 50 miles. If I still hadn't found anything, I would decrease the population to the next threshold and try again. If I found more than one in a given category I chose the closest, in this initial approach (the largest is obviously another alternative, but neither will be the right answer in all cases).
This worked reasonably well, returning London and Vancouver for the examples already mentioned. But it gave some wrong answers too, including Denver Airport which was associated with Aurora (a large suburb of Denver), and for a lot of small town airports it returned a larger town nearby, which in some cases might have been reasonable but in many cases wasn't.
So I decided to extend my algorithm to include matching on names - if there was a city called 'Denver' near 'Denver International Airport' then that is the one I was after. This required a little bit of SQL trickery. If I knew the city name and wanted to search for airports this is easy, you just use a SQL clause like:
where name like '%Denver%'
But it was the other way around, the value I had was a superstring of the value in the field I was querying. I found that in PostgreSQL you can do a statement like the following:
where 'Denver International Airport' like '%' || name || '%'
(|| is the string concatenation in PostgreSQL, so if the value in the field "name" is "Denver", the expression evaluates to 'Denver International Airport' like '%Denver%', which is true). I wouldn't really want to be running that sort of clause alone against the very large geonames table, for performance reasons, but since I also had clauses based on location and population to use as primary filters, performance was fine. And in fact to eliminate issues of upper versus lower case, the clause actually looked like:
where 'denver international airport' like lower('%' || name || '%')
So this would match the city names I found to any substring of the airport name (whether the city name was at the beginning or not). If I found a matching city name within a specified distance (I am currently using 40 miles), I use that, if not then I fall back to using the first approach to look for a "large city" nearby. On my first pass through with this approach, I was able to match names for 2356 of the 3562 airports with an IATA code.
I noticed that some cases were not matching when they looked like they should, where the relevant city names had accented characters. I realized that in some cases, the airport name had been entered with non-accented characters, so it was not matching the version of the city name which did have accented characters. The geonames data includes both an accented and non-accented (ascii) version of each city name, so I extended my where clause to do the wild card matching above on either the (accented) name field or the (non-accented) asciiname field. This increased the number of matching names to 2674, which was a pretty good improvement.
I noticed that in a few places, there were two potential "city" names in the airport name - in particular London Gatwick was matching on a "city" called Gatwick, rather than London, and Amsterdam Schiphol was matching a "city" called Schiphol. Looking at maps of the local area, I'm actually not convinced there is a city (or even a village) called Gatwick, and on further examination the geoname record shows its population as zero, and the same turned out to be true of Schiphol. But regardless, I decided to handle this by checking whether there was more than one city name match with the airport name, within the search radius, and if so to choose the largest city found (rather than the closest). There are some airports which serve two real cities also, and have both in their title, so this is a reasonable approach in those cases (no offense intended to the smaller cities!). This change returned me London instead of Gatwick and Amsterdam instead of Schiphol, as I wanted.
I was now getting pretty close, but I stumbled on a couple of small local airports where I was choosing a really really small town which happened to be closest, rather than a not quite so small town nearby which was really the obvious choice. For example, for Garfield County Airport in the mountains of Colorado, I was picking the town of Antlers (population listed as 0, though I think it might be a few more than that) rather than Rifle, population 7897! This was fixed just by added one more value to my population thresholds (I used 5000).
Obviously tweaking the population and distance thresholds would change some results, but from a quick skim I think the current results are pretty reasonable. One example which I am not sure whether to regard as right is JeffCo airport, a small airport which is in Broomfield, just outside Denver. The current thresholds associate this with Denver, which is probably reasonable, but you could argue that Broomfield is large enough to be named (45000).
If you're interested in checking out the full list, to see if your favorite airport is assigned to the city you think it should be associated with, you can check out this text file (the encoding of accented characters is garbled here, though it is correct in our database - but I haven't taken the time to figure out how to handle this using basic line printing in Java). Let me know if you think anything is wrong! The format of a line in the report is as follows:
13: GRZ Graz-Thalerhof-Flughafen -- 8073 Feldkirchen to Graz (Graz), true
The IATA airport code is first (GRZ), then the airport name from geonames (Graz-Thalerof-Fluhafen), then the city name we got from Yahoo reverse geocoding (8073 Feldkirchen), then the associated city name generated by our algorithm (Graz), followed by the ascii version of the name in parentheses (the same in this case), and lastly the "true" indicates that a match was found on the city name, rather than just using proximity and population.
So anyway, I thought this was an interesting example of how you can use the geonames dataset. I would be happy to contribute these city names back to geonames if people think this would be valuable - it is on my list to look into how best to do this, but if anyone has particular suggestions on this front let me know.
Monday, September 29, 2008
Sneak Preview of GeoCommons Maker from FortiusOne
Sean Gorman from FortiusOne was kind enough to let me have a play with the new GeoCommons Maker application ahead of its upcoming release. I don't have time for a detailed review right now, but overall my first impressions of it are very good. Maker is their new product focused on enabling non-expert users to make nice maps. Map layers can be of three types - basic reference data, or chloropleth or graduated symbol thematic maps.
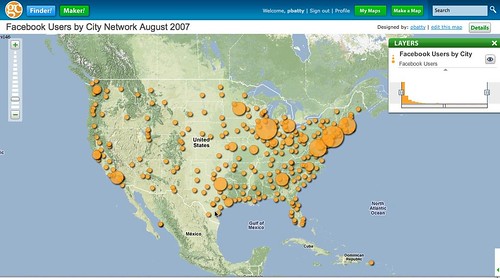
The following is a graduated symbol map showing number of Facebook users by city in the US.
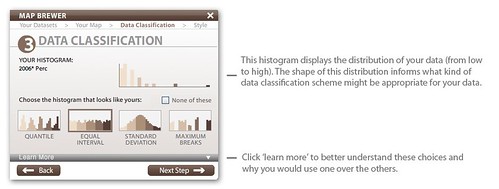
This is an example of one of the map creation screens - the whole process has nice clear graphics which are well thought out to explain the process and options, with ways of getting more information when you want it.
I am a big fan of FortiusOne's vision of putting spatial analysis in the hands of people who are not geospatial specialists. There are still a lot of traditional GIS people who think the sky will fall in (people may draw invalid conclusions if they don't understand data accuracy, etc etc) if you let "untrained" people analyze geospatial data, but I think this is nonsense. I think the best analogy is the spreadsheet. Of course people can draw incorrect conclusions from any kind of data, geospatial or not, but in the great majority of cases this does not happen, and they discover useful insights. Spreadsheets let "untrained" people do useful analysis on all kinds of other data, and I think that FortiusOne is trying to democratize access to spatial analysis in the same way that the spreadsheet has done for non-spatial data. The benefits of having a much larger set of people able to do basic geospatial analysis are huge.
As I said above, I think that this first release looks great, and I look forward to seeing where they take this in the future. I understand that the public release of this will be coming soon.
The following is a graduated symbol map showing number of Facebook users by city in the US.
This is an example of one of the map creation screens - the whole process has nice clear graphics which are well thought out to explain the process and options, with ways of getting more information when you want it.
I am a big fan of FortiusOne's vision of putting spatial analysis in the hands of people who are not geospatial specialists. There are still a lot of traditional GIS people who think the sky will fall in (people may draw invalid conclusions if they don't understand data accuracy, etc etc) if you let "untrained" people analyze geospatial data, but I think this is nonsense. I think the best analogy is the spreadsheet. Of course people can draw incorrect conclusions from any kind of data, geospatial or not, but in the great majority of cases this does not happen, and they discover useful insights. Spreadsheets let "untrained" people do useful analysis on all kinds of other data, and I think that FortiusOne is trying to democratize access to spatial analysis in the same way that the spreadsheet has done for non-spatial data. The benefits of having a much larger set of people able to do basic geospatial analysis are huge.
As I said above, I think that this first release looks great, and I look forward to seeing where they take this in the future. I understand that the public release of this will be coming soon.
Monday, September 22, 2008
Britain from Above
Some very cool visualization of GPS traces in this short video from the BBC, from the series "Britain from Above". I suspect someone in the geo-blogosphere must have posted about this previously, but I hadn't seen it. The taxi cab traces are reminiscent of animations I have seen Steve Coast present when talking about the origins of OpenStreetMap - but with fancier BBC graphical production in this case! Thanks to Johnny Klein for referring me to this, via MindSpark.
Friday, September 19, 2008
Analysis at the speed of thought, and other interesting ideas
As I have posted previously, I spent last week out at the Netezza User Conference, where they announced their new Netezza Spatial product for very high performance spatial analytics on large data volumes. I thought it was an excellent event, and I continue to be very impressed with Netezza's products, people and ideas. I thought I would discuss a couple of general ideas that I found interesting from the opening presentation by CEO Jit Saxena.
The first was that if you can provide information at "the speed of thought", or the speed of a click, this enables people to do interesting things, and work in a different and much more productive way. Google Search is an example - you can ask a question, and you get an answer immediately. The answer may or may not be what you were looking for, but if it isn't you can ask a different question. And if you do get a useful answer, it may trigger you to ask additional questions to gain further insight on the question you are investigating. Netezza sees information at the speed of thought as a goal for complex analytics, which can lead us to get greater insights from data - more than you would if you spent the same amount of time working on a system which was say 20 times slower (spread over 20 times as much elapsed time), as you lose the continuity of thought. This seems pretty plausible to me.
A second idea is that when you are looking for insights from business data, the most valuable data is "on the edges" - one or two standard deviations away from the mean. This leads to another Netezza philosophy which is that you should have all of your data available and online, all of the time. This is in contrast to the approach which is often taken when you have very large data volumes, where you may work on aggregated data, and/or not keep a lot of historical data, to keep performance at reasonable levels (historical data may be archived offline). In this case of course you may lose the details of the most interesting / valuable data.
This got me to thinking about some of the places where you might apply some of those principles in the geospatial world. The following examples are somewhat speculative, but they are intended to get people thinking about the type of things we might do if we can do analysis 100x faster than we can now on very large data volumes, and follow the principle of looking for data "on the edges".
One area is in optimizing inspection, maintenance and management of assets for any organization managing infrastructure, like a utility, telecom or cable company, or local government. This type of infrastructure typically has a long life cycle. What if you stored say the last 10 or 20 years of data on when equipment failed and was replaced, when it was inspected and maintained, etc. Add in information on load/usage if you have it, detailed weather information (for exposed equipment), soil type (for underground equipment), etc, and you would have a pretty interesting (and large) dataset to analyze for patterns, which you could apply to how you do work in the future. People have been talking about doing more sophisticated pre-emptive / preventive maintenance in utilities for a long time, but I don't know of anyone doing very large scale analysis in this space. I suspect there are a lot of applications in different areas where interesting insights could be obtaining by analyzing large historical datasets.
This leads into another thought, which is that of analyzing GPS tracks. As GPS and other types of data tracking (like RFID) become more pervasive, we will have access to huge volumes of data which could provide valuable insights but are challenging to analyze. Many organizations now have GPS in their vehicles for operational purposes, but in most cases do not keep much historical data online, and may well store relatively infrequent location samples, depending on the application (for a long distance trucking company, samples every 5, 15 or even 60 minutes would provide data that had some interest). But there are many questions that you couldn't answer with a coarse sampling but could with a denser sampling of data (like every second or two). Suppose I wanted to see how much time my fleet of vehicles spent waiting to turn left compared to how long they spend waiting to turn right, to see if I could save a significant amount of time for a local delivery service by calculating routes that had more right turns in them (assuming I am in a country which drives on the right)? I have no idea if this would be the case or not, but it would be an interesting question to ask, which could be supported by a dense GPS track but not by a sparse one. Or I might want to look at how fuel consumption is affected by how quickly vehicles accelerate (and model the trade-off in potential cost savings versus potential time lost) - again this is something that in theory I could look at with a dense dataset but not a sparse one. Again, this is a somewhat speculative / hypothetical example, but I think it is interesting to contemplate new types of questions we could ask with the sort of processing power that Netezza can provide - and think about situations where we may be throwing away (or at least archiving offline) data that could be useful. In general I think that analyzing large spatio-temporal datasets is going to become a much more common requirement in the near future.
I should probably mention a couple of more concrete examples too. I have talked to several companies doing site selection with sophisticated models that take a day or two to run. Often they only have a few days to decide whether (and how much) to bid for a site, so they may only be able to run one or two analyses before having to decide. Being able to run tens or hundreds of analyses in the same time would let them vary their assumptions and test the sensitivity of the model to changes, and analyze details which are specific to that site - going back to the "speed of thought" idea, they may be able to ask more insightful questions if they can do multiple analyses in quick succession.
Finally, for now, another application that we have had interest in is analyzing the pattern of dropped cell phone calls. There are millions of calls placed every day, and this is an application where there is both interest in doing near real time analysis, as well as more extended historical analysis. As with the hurricane analysis application discussed previously, the Netezza system is well suited to analysis on rapidly changing data, as it can be loaded extremely quickly, in part because of the lack of indexes in Netezza - maintaining indexes adds a lot of overhead to data loading in traditional system architectures.
Wednesday, September 17, 2008
Interview with Rich Zimmerman about Netezza Spatial
A new development for the geothought blog, our first video interview! It's not going to win any awards for cinematography or production, but hopefully it may be somewhat interesting for the geospatial database geeks out there :). Rich Zimmerman of IISi is the lead developer of the recently announced spatial extensions to Netezza, and I chatted to him about some technical aspects of the work he's done. Topics include the geospatial standards followed in the development, why he chose not to use PostGIS source code directly, and how queries work in Netezza's highly parallelized architecture.
Interview with Rich Zimmerman about Netezza Spatial from Peter Batty on Vimeo.
Interview with Rich Zimmerman about Netezza Spatial from Peter Batty on Vimeo.
Tuesday, September 16, 2008
Netezza Spatial
I have alluded previously to some interesting developments going on in very high performance spatial analytics, and today the official announcement went out about Netezza Spatial (after being pre-announced via Adena at All Points Blog and James Fee).
For me, the most impressive aspect of today at the Netezza User Conference was the presentation from Shajy Mathai of Guy Carpenter, the first customer for Netezza Spatial, who talked about how they have improved the performance of their exposure management application, which analyzes insurance risk due to an incoming hurricane. They have reduced the time taken to do an analysis of the risk on over 4 million insured properties from 45 minutes using Oracle Spatial to an astonishing 5 seconds using Netezza (that’s over 500x improvement!). Their current application won the Oracle Spatial Excellence “Innovator Award” in 2006. About half of the 45 minutes is taken up loading the latest detailed weather forecast/risk polygons and other related data, and the other half doing point in polygon calculations for the insured properties. In Netezza the data updates just run continuously in the background as they are so fast, and the point in polygon analysis takes about 5 seconds. For insurance companies with billions of dollars of insured properties at risk, this time difference to get updated information is hugely valuable. The performance improvement you will see over traditional database systems will vary depending on the data and the types of analysis being performed - in general we anticipate performance improvements will typically be in the range of 10x to 100x.
Netezza is a company I have been very impressed with (and in the interests of full disclosure, I am currently doing some consulting work for them and have been for several months). They have taken a radically different approach to complex database applications in the business intelligence space, developing a “database appliance” – a combination of specialized hardware and their own database software, which delivers performance for complex queries on large (multi-terabyte) databases which is typically 10 to 100 times faster than traditional relational database architectures like Oracle or SQL Server. There are two primary means by which they achieve this level of performance. One is by highly parallelizing the processing of queries – a small Netezza configuration has about 50 parallel processing units, each one a powerful computer in its own right, and a large one has around 1000 parallel units (known as Snippet Processing Units or SPUs). Effectively parallelizing queries is a complex software problem – it’s not just a case of throwing lots of hardware at the issue. The second key element is their smart disk readers, which use technology called Field Programmable Gate Arrays (FPGAs), which essentially implement major elements of SQL in hardware, so that basic filtering (eliminating unwanted rows) and projection (eliminating unwanted fields) of data all happens in the disk reader, so unnecessary data is never even read from disk, which eliminates a huge bottleneck in doing complex ad hoc queries in traditional systems.
Apart from outstanding performance, the other key benefit of Netezza is significantly simpler design and administration than with traditional complex database applications. Much of this is due to the fact that Netezza has no indexes, and design of indexes and other ongoing performance tuning operations usually take a lot of time for complex analytic applications in a traditional environment.
Netezza’s technology has been validated by their dramatic success in the database market, which in my experience is quite conservative and resistant to change. This year they expect revenues of about $180m, growth of over 40% over last year’s $127m. About a year ago, Larry Ellison of Oracle said in a press conference that Oracle would have something to compete with Netezza within a year. This is notable because it’s unusual for them to mention specific competitors, and even more unusual to admit that they basically can’t compete with them today and won’t for a year. Given the complexity of what Netezza has done, and the difficulty of developing specialized hardware as well as software, I am skeptical about others catching them any time soon.
So anyway (to get back to the spatial details), the exciting news for people trying to do complex large scale spatial analytics is that Netezza has now announced support for spatial data types and operators – specifically vector data types: points, lines and areas. They support the OGC standard SQL for Simple Features, as well as commonly used functions not included in the standard (the functionality is similar to PostGIS). This enables dramatic performance improvements for complex applications, and in many cases lets us answer questions that we couldn’t even contemplate asking before. We have seen strong interest already from several markets, including insurance, retail, telecom, online advertising, crime analysis and intelligence, and Federal government. I suspect that many of the early users will be existing Netezza customers, or other business intelligence (BI) users, who want to add a location element to their existing BI applications. But I also anticipate some users with existing complex spatial applications and large data volumes, for whom Netezza can deliver these substantial performance improvements for analytics, while simplifying adminstration and tuning requirements.
One important thing to note is that Netezza is specifically not focused on "operational" geospatial applications. The architecture is designed to work effectively for mass queries and analysis - if you are just trying to access a single record or small set of records with a pre-defined query, then a traditional database architecture is the right solution. So in cases where the application focus is not exclusively on complex analytics, Netezza is likely to be an add-on to existing operational systems, not a replacement. This is typical in most organizations doing business intelligence applications, where data is consolidated from multiple operational systems into a corporate data warehouse for analytics (whether spatial or non-spatial).
Aside from the new spatial capabilities, the Netezza conference has been extremely interesting in general, and I will post again in the near future with more general comments on some of the interesting themes that I have heard here, including "providing information at the speed of thought"!
Having worked with interesting innovations in spatial database technologies for many years, from IBM's early efforts on storing spatial data in DB2 in the mid to late eighties, to Smallworld's innovations with long transactions, graphical performance and extreme scalability in terms of concurrent update users in the early nineties, and Ubisense's very high performance real time precision tracking system more recently, it's exciting to see another radical step forward for the industry, this time in terms of what is possible in the area of complex spatial analytics.
Friday, September 12, 2008
If you could do geospatial analysis 50 to 100 times faster ... (revisited)
A little while back I posted on the topic of what compelling new things would you do if you could do geospatial analysis 50-100 times faster than you can today, on very large data volumes. This generated quite a bit of interesting discussion both on my blog and over at James Fee's. This project will be coming out of stealth mode with an announcement next week - if you are a friend of mine on whereyougonnabe you should be able to figure out where the technology is coming from (you can also get the answer if you watch this 3 minute video carefully)!
One interesting thing you might do is analyze the projected impact of hurricane Ike in a much more comprehensive and timely fashion than you can do with current technologies, and we'll have a case study about that next week. I'll be blogging about all this in much more detail next week.
One interesting thing you might do is analyze the projected impact of hurricane Ike in a much more comprehensive and timely fashion than you can do with current technologies, and we'll have a case study about that next week. I'll be blogging about all this in much more detail next week.
Thursday, September 4, 2008
New release of whereyougonnabe
We are pleased to announce another new release of whereyougonnabe.
Some key features include:
As always, we welcome your feedback on the new features, and ideas for further improvements. We will have another new release coming very shortly with a number of things that didn’t quite make it in time for this one. You can try the new release here.
Some key features include:
- WYTV, a new animated map display inspired by the cool Twittervision, but using data from whereyougonnabe. This displays an interesting mix of activities from your friends and public activities from other users. You can click through on friends’ activities to see more details.
- Calendar synchronization now uses Google Local Search, based on the context of which city you’ve told us you’re in. So if you’re in Denver, CO and you put a location of “1100 Broadway” or “Apple Store” on an activity in your calendar that week, it will find a suitable location in Denver.
- We now support display of distances in kilometers as well as miles, a request we have had from several users. If your home is in the US or UK the default setting is miles, elsewhere it is km. You can change your preference on the settings page.
- The experience for new users is improved – when you add the application you can immediately view data from your friends, or public activities from other users, without having to enter any data. Users just need to tell us their home location before creating their own activities. There is more to come on this theme.
- Various small usability improvements and bug fixes.
As always, we welcome your feedback on the new features, and ideas for further improvements. We will have another new release coming very shortly with a number of things that didn’t quite make it in time for this one. You can try the new release here.
Wednesday, September 3, 2008
A tale of two presentations
I have two presentations scheduled next week, with a major contrast in styles - one is 5 minutes and the other is 90 minutes. The first is at Ignite Denver, which is at Fado Irish pub in downtown Denver on Wednesday evening next week (September 10th). Ignite is an O'Reilly sponsored event with an interesting format:
If you had five minutes on stage what would you say? What if you only got 20 slides and they rotated automatically after 15 seconds? Around the world geeks have been putting together Ignite nights to show their answers.
You can register here for free (and if you want to be on my team for the trivia quiz let me know!). I'll be talking about my thoughts on future location and social networking, among a fairly eclectic agenda which ranges from a variety of techie topics to the wonderful world of cigars and how to swear in French! I'm looking forward to the challenge of trying out this presentation format for the first time. If you're in the neighborhood I encourage you to stop by, I think it should be fun.
The following day, Thursday September 11, I switch from having to talk about future location for 5 minutes to talking for an hour and a half at the GIS in the Rockies conference in Loveland, CO. The standard presentations there are 30 minutes but the organizers asked if I would talk for longer, which was nice of them! It was a tough job to get my GeoWeb presentation into 30 minutes, so I'll have the luxury of being able to expand on the topics I talked about there, as well as talking more about the technology we're using, including PostGIS and Google Maps, more about some of the scalability testing and system design challenges we have addressed, and more about how I see the overall marketspace we're in and how we fit into that. I'm on from 3:30pm to 5pm - hope to see some of you there.
Tuesday, September 2, 2008
First experience with Google Chrome
Whereyougonnabe makes heavy use of JavaScript in the browser, using the Ext JS library, which provides a very rich and dynamic user experience but also tests the limits of browser compatibility. This is especially true when running inside Facebook, which provides another level of complexity and has a knack of showing up obscure low level differences between browsers - we have hit several tricky issues in handling sessions and security recently. FireFox has generally given us the fewest issues. Early on we had some problems with Safari, and today we have had a day of major frustration as we were about to launch a new release, everything was running fine on FireFox and Safari, and on Internet Explorer if you ran our application outside a Facebook frame, but inside Facebook Internet Explorer has suddenly started abruptly refusing to load pages with no helpful error messages - we're still bashing our heads against the wall trying to track this one down.
So I have to say my initial reaction to seeing that Google has announced a new browser called Chrome was "oh no, not another browser to support". It's currently Windows only which I also wasn't too keen on. But nevertheless I fired up my Windows laptop for the second time in a week to try it out. And I was pleasantly surprised and impressed that it worked first time with whereyougonnabe with no apparent problems :) !! And subjectively it seemed fast too. We'll be testing it more thoroughly of course, but first impressions are encouraging in terms of compatibility with complex Javascript applications, which Google claim as a major design aim for Chrome.
Sunday, August 24, 2008
Quick review of Microsoft Photosynth
As regular readers know, I've been an Apple convert for over a year now, and unlike a number of my friends who run multiple operating systems on their Macs, I have had no compelling reason to run Windows and so have resisted that and been living a largely Windows-free existence. The two main things I miss with not running on Windows are some of the cool 3D things Microsoft has been doing with Virtual Earth, and the impressive Photosynth. When Microsoft announced that Photosynth had moved from a closed demo version with a few sample datasets to a version which lets you create your own "synths", I thought I needed to give it a try (being a keen photographer).
I went to the site using my Mac and got the following message:
So anyway, I decided there was nothing for it but to dust off my old Toshiba Windows laptop and give the new Photosynth a try. When I first saw the original Photosynth videos, I was super impressed, but also a bit skeptical about some of the more extravagant claims of automatically hyperlinking all the photos on the Internet - it just seemed to me that there wouldn't be enough differented features in many photos for that to work. And that is somewhat borne out by this guide to creating good "synths", and by my experience so far using Photosynth - there are definitely techniques to follow to make sure that the process works well. Check the guide for full details, but in general it is good to take a lot of overlapping photos, more than you might think, with relatively small changes in angle or zoom to ensure that all the photos are matched.

I created several synths today, starting with a couple of the inside of my loft, and then doing some exterior ones. You can check them out here (Windows only, as previously noted - and you have to install a plug-in, but it's worth it). Overall the process was very easy and I was impressed with the results. It took about 10-15 minutes to create and upload a small synth, and a little over an hour for the largest one. You have to upload the data and make it publicly available at the moment (it sounds as though there may be more flexibility in this regard in future).
In a few cases, it didn't match photos which I thought it would have done. In general the issues seem to be either when you zoom or change angle by too large an amount, and it seemed to have a little more of a problem with non-geometric objects than with those with a regular shape. Also in a few cases I found the navigation didn't quite work as I expected. In the models of the Wynkoop Brewing Company and Union Station, it built everything into one continuous model, but I seem to only be able to navigate continuously around one half of the model or the other (you can jump from one to the other by switching to the grid view and selecting a picture in the other half of the model). If anyone discovers a trick which enables them to navigate around the whole of either of these models in 3D view let me know. I assume that this would probably not be an issue if I had taken more pictures going around a couple of the building corners. I also tried building synths of two smaller models - the Brewing Company and Union Station down the street, as well as a larger model which incorporated all the photos in the two smaller ones, plus a number of additional connecting photos - and it was interesting that some photos which matched in the smaller models did not match in the larger model (even though the photos they matched with previously were still there).
A cool user interface feature is the ability to display the point cloud generated by Photosynth by holding down the control key, and dragging the mouse to rotate. And another cool thing to try is using a scroll wheel to zoom in dynamically on the current image.
It's fun to be able to take pictures at very different detail levels - if you look around in the larger synth of my loft, you can find one of my favorite recipes and see what's on my computer screens. I think there's quite a bit of scope for doing cool creative things in synths - Paula appears in a few of the photos in my loft, and not in others with similar viewpoints, which gives an interesting effect, and I think you could have some fun with changing small things in between photos (but not so much that Photosynth can't match correctly). I think you could also add annotation to certain images, that is on my list of things to try too. I also plan to experiment with doing some which combine different lighting conditions, and would like to do some HDR photosynths using photos like the following - which will be a bit more work but I think would be well worth the effort.


Coincidentally, I recently heard from Gigapan Systems that I have made it onto the list to get one of their beta panoramic imaging systems, which should be arriving shortly, so it will be interesting to compare the two different approaches to creating immersive image environments. I don't expect to compete with Stefan's impressive Ogle Sweden expedition, but hope to find time to do a few more cool synths and panoramas over the next few weeks.
I went to the site using my Mac and got the following message:
Unfortunately, we're not cool enough to run on your OS yet. We really wish we had a version of Photosynth that worked cross platform, but for now it only runs on Windows. Trust us, as soon as we have a Mac version ready, it will be up and available on our site.That was actually better than I thought - I'm pleased to see that they have a Mac version planned, and also that they have a bit of a sense of humor in their announcement :).
So anyway, I decided there was nothing for it but to dust off my old Toshiba Windows laptop and give the new Photosynth a try. When I first saw the original Photosynth videos, I was super impressed, but also a bit skeptical about some of the more extravagant claims of automatically hyperlinking all the photos on the Internet - it just seemed to me that there wouldn't be enough differented features in many photos for that to work. And that is somewhat borne out by this guide to creating good "synths", and by my experience so far using Photosynth - there are definitely techniques to follow to make sure that the process works well. Check the guide for full details, but in general it is good to take a lot of overlapping photos, more than you might think, with relatively small changes in angle or zoom to ensure that all the photos are matched.
I created several synths today, starting with a couple of the inside of my loft, and then doing some exterior ones. You can check them out here (Windows only, as previously noted - and you have to install a plug-in, but it's worth it). Overall the process was very easy and I was impressed with the results. It took about 10-15 minutes to create and upload a small synth, and a little over an hour for the largest one. You have to upload the data and make it publicly available at the moment (it sounds as though there may be more flexibility in this regard in future).
In a few cases, it didn't match photos which I thought it would have done. In general the issues seem to be either when you zoom or change angle by too large an amount, and it seemed to have a little more of a problem with non-geometric objects than with those with a regular shape. Also in a few cases I found the navigation didn't quite work as I expected. In the models of the Wynkoop Brewing Company and Union Station, it built everything into one continuous model, but I seem to only be able to navigate continuously around one half of the model or the other (you can jump from one to the other by switching to the grid view and selecting a picture in the other half of the model). If anyone discovers a trick which enables them to navigate around the whole of either of these models in 3D view let me know. I assume that this would probably not be an issue if I had taken more pictures going around a couple of the building corners. I also tried building synths of two smaller models - the Brewing Company and Union Station down the street, as well as a larger model which incorporated all the photos in the two smaller ones, plus a number of additional connecting photos - and it was interesting that some photos which matched in the smaller models did not match in the larger model (even though the photos they matched with previously were still there).
A cool user interface feature is the ability to display the point cloud generated by Photosynth by holding down the control key, and dragging the mouse to rotate. And another cool thing to try is using a scroll wheel to zoom in dynamically on the current image.
It's fun to be able to take pictures at very different detail levels - if you look around in the larger synth of my loft, you can find one of my favorite recipes and see what's on my computer screens. I think there's quite a bit of scope for doing cool creative things in synths - Paula appears in a few of the photos in my loft, and not in others with similar viewpoints, which gives an interesting effect, and I think you could have some fun with changing small things in between photos (but not so much that Photosynth can't match correctly). I think you could also add annotation to certain images, that is on my list of things to try too. I also plan to experiment with doing some which combine different lighting conditions, and would like to do some HDR photosynths using photos like the following - which will be a bit more work but I think would be well worth the effort.
Coincidentally, I recently heard from Gigapan Systems that I have made it onto the list to get one of their beta panoramic imaging systems, which should be arriving shortly, so it will be interesting to compare the two different approaches to creating immersive image environments. I don't expect to compete with Stefan's impressive Ogle Sweden expedition, but hope to find time to do a few more cool synths and panoramas over the next few weeks.
Thursday, August 21, 2008
Earthscape on iPhone
Thanks to Jesse at Very Spatial for the tip that my friends Tom Churchill and gang at Earthscape have released their virtual globe product for the iPhone. They have developed a lot of very cool virtual globe technology and have been looking at various directions they could take it in (competing head on with Google Earth and Virtual Earth being a tough proposition!), and I think that the iPhone direction is a really promising one for them.
This first version is missing some obvious features such as search, but the slick navigation means that you miss that less than you might think. I imagine that and other features will probably come along soon though, and I know they had various other cool ideas so I look forward to seeing more good things in future releases. One thing that is missing from earlier prototypes that I saw is changing the view based on tilting the iPhone. I think this is probably a good decision - this approach had novelty value but was hard to control well, and I think that the navigation controls they have now are very intuitive.
Overall it definitely has a high "cool factor" for showing off the graphics and touch screen capabilities of the iPhone, which I think is a big factor in driving application sales at this early stage of the iPhone application platform. Congrats to the team at Earthscape on getting the product out!
More on Google Local Search
As I recently discussed, we have decided to use Google Local Search rather than Google Geocoding (well, rather than a hybrid approach) for whereyougonnabe. That post got some interesting comments, including one from Pamela Fox of Google who said that Local Search will soon be using Tele Atlas data (rather than NAVTEQ according to one of the other posts, though she didn't say that explicitly), and the implication was that this was the same source data as the Google Geocoder. One would hope that this may mean that they are bringing the two services together, which would be a lot nicer for users. I also ran into Martin May from Brightkite yesterday at the Techstars investor day (which was excellent) and he mentioned that they are making the same move, which was interesting - it turned out we had been looking at a lot of common issues at the same time.
Anyway, I thought I would follow up with a little more discussion on some of the benefits we see of using Google Local Search, as well as some outstanding issues. One aspect that I really like is that you can give it a search point to provide context, and this is very useful for our application. We are especially leveraging this in our calendar synchronization. A typical (and recommended) way of using the system when you are traveling is to create a high level activity saying that, for example, you are in New York City for four days next week, and then subsequently enter more specific activities for those days. When you add an activity in your calendar, we look at the location string in the context of where we think you are on that date. So for example, if I just said I was having lunch at 1100 Broadway, it would locate me at 11 Broadway in New York during those four days, or at 1100 Broadway in Denver if I was at home. And as I discussed in the previous post, the feature we like most about Local Search is that you can search for business names, and again these take that location context, which makes it very easy to specify many locations. Some examples that I have used successfully at home in Denver include "Union Station", "Vesta Dipping Grill" (or just "Vesta"), "Enspiria" (a company where I have an advisory role"), and even "Dr Slota" (my dentist). It's very convenient to be able to use names like this rather than having to look up addresses.
So that's great, but there are still a few issues. One is that Local Search really doesn't work well for airports - if you enter a 3 letter airport code it is very hit or miss whether it finds it. I'm pretty sure this used to work a lot better, though I haven't tracked down specific tests to prove that. But we plan to do our own handling of this case (unless we see an improvement really soon), using geonames (which we already use for locating airports in our tripit interface, but we haven't hooked this into our general geocoding).
I reported over a year ago that I felt there were some issues with Google Local Search on the iPhone, so I thought it would be interesting to revisit some of the same problem areas I reported on then. These problems generally revolved around local search being too inclusive in the data it incorporates, which is good in terms of finding some sort of result, but the risk is that you get bad data back in some cases. Given the good results I had found in my initial testing this time round, I expected that I would probably see some improvement, so I was a little surprised to find that in general most of the same problems were still there. You can see these by trying the search terms in Google Maps (and in MapQuest for comparison).
My test cases were as follows, centered around my home at 1792 Wynkoop St, Denver:
- King Soopers (a local supermarket chain): last time in the top 10 on Google, there were three entries with an incomplete address (just Denver, CO), all of which showed as being closer than the closest real King Soopers, and there was one (wrong) entry which said it was an "unverified listing". This time, there was just one incomplete address like this, so that was a definite improvement, but unfortunately this appeared top of the list so the closest King Soopers was not returned as the "best guess" from the local search API. There were two other bogus looking entries in the top 4, for a total of 3 apparently bad results in the top 10. On MapQuest, 10 legitimate addresses are returned, though in some cases they appear to have multiple addresses for the same store (e.g. entry points on two different streets) - but this is not a serious error as you would still find a King Soopers. This was the same as last time. I tried typing "King Soopers Speer" (the name of the street where the store is located) and that returned me the correct location as the top result.
- Tattered Cover (a well known Denver book store with 3 locations). MapQuest returns just 3 results, all correct. Google Maps returns 9 entries in its initial list, of which three have incomplete addresses (duplicates of entries which do have complete addresses, but they show up at entirely different locations on the map), one is a store which closed two years ago, and one is a duplicate of a correct store. The old store does say removal requested, but it seems surprising that this closed two years ago and is still there.
- Searches for Office Depot and Home Depot were more successful, with no obvious errors - hooray :) !! This was the same as last time.
- Searching for grocery in Google Maps online last time returned Market 41, a nightclub which closed a year before, and four entries with incomplete addresses. This time there were only two which looked bad (including the King Soopers with an incomplete address we saw before). The same search on MapQuest had one incomplete address, the rest of the results looked reasonable. So a definite improvement in this case.
Improving software quality
I had missed this previously but Glenn reported from the ESRI conference that the "#1 time saver" in ArcGIS 9.3 is the ability to report product bugs more efficiently :O. Don't get me wrong, all products have bugs, I'm all for being able to report them easily, and this is a useful feature. And I'm sure customers are pleased to hear about a focus on software quality. But to me it sends a pretty negative message to the marketplace about how much time your users spend entering bugs for any software company to present this as the top productivity improvement in a major new release - it seemed like a very odd way to present it to me!
However, ESRI has not gone as far as Microsoft in its dedication to improving software quality. A friend of mine recently drew my attention to the program highlighted in the video below, which I highly recommend watching. I am thinking of instituting a similar program at Spatial Networking :) !!
However, ESRI has not gone as far as Microsoft in its dedication to improving software quality. A friend of mine recently drew my attention to the program highlighted in the video below, which I highly recommend watching. I am thinking of instituting a similar program at Spatial Networking :) !!
Wednesday, August 13, 2008
Google Local Search better than Google Geocoding?
Google offers two (apparently) unrelated solutions for doing geocoding (converting a text string into a latitude-longitude and a structured address): the Google Geocoding API (which is part of the Google Maps API) and the Google Local Search API (which has JavaScript and non-JavaScript variants). This post discusses our experiences with both and the results of recent testing we have been doing, which has led us to a decision to switch from our current hybrid approach to using only local search.
Initially we were attracted to using Google Local Search for whereyougonnabe, as it lets you search for places of interest like "Wynkoop Brewing Company" or "Intergraph Huntsville", rather than having to know an address in all cases - whereas the geocoding API only works with addresses.
However, in our initial testing with local search we found a number of cases where it returned a location and address string successfully, but did not properly parse the address into its constituents correctly (for example, returning a blank city). For our application it was important to be able to separate out the city from the rest of the address. In our initial testing, the geocoding API seemed to do a better job of correctly parsing out the address. In addition, it returned a number indicating how accurate the geocoding was (for example street level or city level). So we ended up implementing a rather ugly hybrid solution, where we first used local search to allow us to search for places of interest in addition to addresses, and then passed the address string which was returned to the geocoding API to try to structure it more consistently. In most cases this was transparent to the user, but in a number of cases we hit problems where the second call would not be able to find the address returned by the first call, or where the address would get mysteriously "moved". With so much to do and so little time :) we elected to go with this rather unsatisfactory solution to start with, but I have recently been revisiting this area, and doing some more detailed testing of the two options.
Before I get into more details of the testing, I should just comment on a couple of other things. One is that a key reason we are revisiting our geocoding in general is that we recently introduced the ability to import activities from external calendar systems, which means we need to call geocoding functionality from our server from a periodic background process, whereas before that we just called it from the browser on each user's client machine. This is sigifnicant because the Google geocoding API restricts you to 15,000 calls per IP address per day, which is not an issue at all if you do all your geocoding on the client but quickly becomes an issue if you need to do server based geocoding. Interestingly, Google Local Search has a different approach, with no specified transaction limits (which is not to say that they could not introduce some of course, but it's a much better starting point than the hard limit on the geocoding API).
Secondly, a natural question to ask is whether we have looked at other solutions beyond these two, and the answer is yes, though not in huge detail. Most of the other solutions out there do not have the ability to handle points of interest in addition to addresses, which is a big issue for us. Microsoft Virtual Earth looks like the strongest competitor in this regard, but it seems that we would need to pay in order to use that, and we need to talk to Microsoft to figure out how much, which we haven't done yet - and obviously if we can get a free solution which works well we would prefer that. Several solutions suffer from lack of global coverage and/or even lower transaction limits than Google. We are using the open source geonames database for an increasing number of things, which I'll talk about more in a future post, but that won't do address level geocoding and points of interest are more limited than in Google (currently at least).
Anyway, on to the main point of the post :) ! I tested quite a variety of addresses and points of interest on both services. Some of these were fairly random, a number were addresses which specific users had reported to us as causing problems in their use of whereyougonnabe. In almost all the specific problem cases, we found that the issue was with the geocoding API rather than local search. The following output shows a sample of our test cases (mainly those where one or other had some sort of problem):
I=Input, GC=geocoding API result, LS=local search API result, C=comments
I: 1792 Wynkoop St, Denver
GC: 1792 Wynkoop St, Denver, CO 80202, USA
LS: 1792 Wynkoop St, Denver, CO 80202
C: LS did not include country in the address string returned, but it was included separately in the country field. The postcode field was not set in LS, even though it appeared in the address string. Other fields including the city and state (called "region") were broken out correctly. This was typical with other US addresses - LS did not set the zip code / postal code, but otherwise generally broke out the address components correctly.
I: 42 Latimer Road, Cropston
GC: 42 Latimer Rd, Cropston, Leicestershire, LE7 7, UK
LS: null
C: The main case where GC fared better was with relatively incomplete addresses, like this one with the country and nearest large town omitted (Cropston is a very small village)
I: 72 Latimer Road, Cropston, England
GC: 72 Latimer Rd, Cropston, Leicestershire, LE7 7, UK
LS: 72 Latimer Rd, Cropston, Leicester, UK
C: Both worked in this case, with slight variations. GC included the postal code (a low accuracy version) and LS did not. LS included the local larger town Leicester which is technically part of the mailing address.
I: 8225 Sage Hill Rd, St Francisville, LA 70775
GC: null
LS: 8225 Sage Hill Rd, St Francisville, LA 70775
C: One of several examples from our users which didn't work in GC but did in LS.
I: Wynkoop Brewing Company Denver
GC: null
LS: 1634 18th St, Denver, CO
C: As expected, points of interest like this do not get found by GC
I: Kismet, NY
GC: Kismet Ct, Ridge, NY 11961, USA
LS: Kismet, Islip, NY
C: Another real example from a user, where GC returned an incorrect location about 45 miles away from the correct location, which was found by LS.
I: 1111 West Georgia Street, Vancouver, BC, Canada
GC: 1111 E Georgia St, Vancouver, BC, Canada
LS: 1111 W Georgia St, Vancouver, BC, Canada
C: Another real example from a user which GC gets wrong - strangely it switches the street from W Georgia St to E Georgia St, which moves the location about 2 miles from where it should be.
I: London E18
GC: London, Alser Strafle 63a, 1080 Josefstadt, Wien, Austria
LS: London E18, UK
C: Another real user example. London E18 is a common way of denoting an area of London (the E18 is the high level portion of the postcode). GC gets it completely wrong, relocating the user to Austria, but LS gets it right.
So in summary, in our test cases we found a lot more addresses that could not be found or were incorrectly located by the Google Geocoding API, but were correctly located by Google Local Search, than vice versa. It is hard to draw firm conclusions without doing much larger scale tests, and it is possible that there is a bias in our problem cases as our existing application may have tended to make more problems visible from the Geocoding API than from Local Search (it is hard to tell whether this is the case or not). But nevertheless, based on these tests we feel much more comfortable going with Local Search rather than the Geocoding API, especially given its compelling benefits in locating points of interest by name rather than address. These point of interest searches can also take a search point, which is also a very useful feature for us, which I will save discussion of for a future post. Advantages of the geocoding API are that it returns an accuracy indicator and generally returns the zip/postal code also, neither of which are true for Local Search. Neither of these were critical issues for us, though we would really like to have the accuracy indicator in local search also. For our application we are not too concerned about precisely how the addresses align with the base maps - one reason I have heard given in passing for Google having these two separate datasets is that they want a geocoding dataset which uses the same base data as Google Maps uses, to try to ensure that locations returned by geocoding align as well as possible with the maps. If this is a high priority for your application, you might want to test this aspect in more detail. It also appears that the transaction limits are more flexible for server based geocoding with Local Search.
So we'll be switching to an approach which uses only Google Local Search in an upcoming release of whereyougonnabe. I'll report back if anything happens to change our approach, and I'll also talk more about what we're doing with geonames relating to geocoding in a future post.
Wednesday, July 30, 2008
Off to San Diego next week - and more GeoWeb coverage
Well, after my first ever visit to the ESRI User Conference last year, I'm going to be back there again this year, with my Enspiria hat on this time. Hope to catch up with some of you there ... I'll be around at the Enspiria booth a good bit of the time (#1907). Also, Enspiria has organized a cruise on Wednesday evening which is filling up but we have a few spots left so if you'd be interested in joining us let me know and I'll see if I can get you a ticket (no promises though!).
In other news, my GeoWeb presentation has been continuing to get some good coverage - after Ogle Earth gave it a good review, it also got mentions at Google Earth blog, Google Maps Mania (twice), and by Paul Bissett at Fiducial Marks. I have a lot of notes from GeoWeb and will try to do a post writing up my thoughts on the conference soon. But I'm off to the Santa Fe Opera tomorrow morning for a long weekend, where I look forward to catching up with my old friend Warren Ferguson, so it may have to wait until next week :).
In other news, my GeoWeb presentation has been continuing to get some good coverage - after Ogle Earth gave it a good review, it also got mentions at Google Earth blog, Google Maps Mania (twice), and by Paul Bissett at Fiducial Marks. I have a lot of notes from GeoWeb and will try to do a post writing up my thoughts on the conference soon. But I'm off to the Santa Fe Opera tomorrow morning for a long weekend, where I look forward to catching up with my old friend Warren Ferguson, so it may have to wait until next week :).
Friday, July 25, 2008
Nice review of my GeoWeb presentation
Stefan at Ogle Earth gave a nice review of my GeoWeb presentation:
I ended up watching Peter Batty's entire presentation at GeoWeb on "Future Location and Social Networking". I hadn't planned to, but I was surprised to find a lot more deep thinking than I imagined was possible about this market segment.Thanks Stefan! As I try to explain in the presentation, I do think there's a lot more to this space than meets the eye, when you get more deeply into it. Stefan also mentions that there are some cool Google Earth visualizations at the end, which you can see separately here, though of course I enourage you to watch the whole thing!
Thursday, July 24, 2008
My presentation on "Future Location and Social Networking" at GeoWeb
I gave my presentation at the GeoWeb conference yesterday and it generated a good bit of interest. I recorded it with the brilliant ScreenFlow software which I have been using extensively to do screen capture videos, but this is the first time I tried it with a conference presentation and it worked very well. I talked previously about what I was planning to talk about - in summary, it's about the ideas we have about modeling future location for whereyougonnabe, and I talk quite a bit about the bigger picture of where we plan to take it - combining space, time and the social graph to create a new infrastructure for calendaring and scheduling.
GeoWeb presentation: The Power of Future Location for Social Networking from Peter Batty on Vimeo.
GeoWeb presentation: The Power of Future Location for Social Networking from Peter Batty on Vimeo.
It's about 30 minutes long but I encourage you to take the time to check it out, I really think that the whole future location area is a very interesting one!
Wednesday, July 16, 2008
OpenStreetMap mapping party in Denver this weekend (at my loft)
Steve Coast, the founder of OpenStreetMap, is visiting Denver this weekend for a mapping party which I will be hosting at my loft above the Wynkoop Brewing Company, followed by beers downstairs. We will be holding one on Saturday and one on Sunday, people are welcome to attend either or both. We'll start at 1pm each day with a talk from Steve about OpenStreetMap, which I think is one of the more interesting developments in the industry recently, as I've talked about before - a prime example of the "crowdsourcing" phenomenon. We encourage everyone to join us for some mapping too, but if you just want to come for the talk (or the beers later), that's fine too. Please sign up on the wiki page if you plan to come.
Here is more information from Steve:
OpenStreetMap, the free wiki world map is coming to Denver this weekend 19/20th July for a mapping party.
OpenStreetMap allows anyone to edit a map of the world, much like wikipedia allows anyone to edit a world encyclopaedia. A mapping party is an informal daytime event where volunteers of all walks of life help map an area collaboratively. GPS units and instruction is provided, together with help using the editing tools and ways to collect the data. For more about mapping parties, see here.
We will meet at Peter Batty's loft at 1792 Wynkoop St, #508, at 1pm. It will begin with a short presentation on OpenStreetMap and then you are invited to go mapping. Mapping some streets, footpaths or what interests you can take as little as an hour including being shown how to use the GPS and software. Afterward, we will retire to the Wynkoop Brewing Company and you're welcome to join us.
Please check the wiki page for up to date information.
Monday, July 14, 2008
Presenting at GeoWeb next week
I'll be up in Vancouver next week for the GeoWeb conference, which was excellent last year and it looks like there will be a good program and group of attendees this year too. Whereyougonnabe tells me that 13 of my friends will be in Vancouver at the same time as me, so it's good to see a few people starting to use the system!
I'll be doing a presentation on topics relating to future location, which is of course our focus with whereyougonnabe. As we've got further into this, I've really come to realize that there are some hard problems to solve in the space of future location which have a lot of value, and many ways that the core technology we're developing for our initial social networking application can be applied. I thought I'd just post a brief preview of some of the topics I'll be talking about.
Broadly speaking, I think that the hard problems fall into three main areas:
Modeling and performance. How you model future space-time has a huge impact on what you can do in your application - for example Dopplr is a nice application in many ways, but its underlying model of space-time has some serious limitations which really constrain the functionality they can provide compared to the approach we are using. I'll talk about coarse-grained versus fine-grained modeling of space-time, and using discrete "places" versus a continuous coordinate system. Implementing a fine-grained system with the ability to handle variable search radii in both space and time is pretty challenging from a performance and scalability perspective with large data volumes, and I'll discuss some aspects of how we've approached this. I'll also talk about various interesting modeling challenges including handling overlapping activities, uncertainty (possible / probable activities), alternative plans (may be either here or there), flexible plans (I'm intending to go to the shopping mall sometime tomorrow afternoon), linear activities (like road or train trips).
Determining what's "interesting". Since we are focused on fine-grained future activities, which may be close to home or far away, users may be "close" to their friends frequently, and what constitutes "close" may vary significantly depending on the context. If I am in England for two weeks I am interested in notifications happening between me and friends who are within a relatively large distance of me (a hundred miles or so, say), whereas if I'm going out for a drink in downtown Denver, where I live, my notification radius should be relatively small. If I have friends who live close to the bar I'm going to, should I notify them about my plans or not - they may well be interested but we don't want to overwhelm people with too much information. I'll talk about factors involved in determining what's interesting, including the distance from home of each person, normal distance between the people, how often you see them, length and nature of the activity, and more.
Gathering data on future activities. Of course one of the big challenges with future location compared to current location is creating the raw data about where people will be and when. Obviously making it easy for people to create activities is one aspect of this, but integration with other data sources is also key, including calendars, online booking systems for travel, restaurant reservations, concert or sporting tickets, etc etc. As we pull data from multiple sources, merging those together in the optimal way can be challenging. I'll discuss a variety of ideas and plans we have in this area.
So that's just a taster of some of the areas I'll be talking about - I'll also talk about more specifics of what we've implemented so far and our experience with the technologies we're used, including PostGIS on the back end (which I've been really impressed with), Google Maps, geocoding and local search, the Ext JS Javascript Library, and more. And I'll talk more about the broader range of applications I see for what we're doing.
I'm talking from 4:30 to 5pm on the Wednesday, July 23, so if you'll be at the conference please stop by!
Sunday, July 13, 2008
Major new release of whereyougonnabe
Apologies again for the lack of posting recently ... a primary reason for this has been we have been heads down adding lots of new stuff to whereyougonnabe recently, plus I've been juggling a number of side projects. But anyway, we are excited about our latest release which went live over the weekend (you can access it here).
whereyougonnabe July 2008 release overview from Peter Batty on Vimeo.
The big theme of the release is integration - we can now automatically import activities from Google Calendar, Tripit, and Dopplr, we have added an iCal feed so you can view whereyougonnabe information in your regular calendar, and you can set your Facebook and/or Twitter status whenever an activity begins. In general, a big challenge with future location is how to create data as easily and automatically as possible, and this is a big step forward in that regard.
We also made significant changes to the way that we calculate interactions and decide what to notify you about, which I have come to realize is a very hard problem, as I have got more into this (which is good, as it is harder for other people to copy what we are doing).
You can read more specific information at our whereyougonnabe blog, or watch the following video for an overview of the new features:
whereyougonnabe July 2008 release overview from Peter Batty on Vimeo.
We also have several more detailed videos explaining how to set up and use the new features. Our big focus for the next release is on the user interface, an area where we have a lot of ideas and plans that we are excited about.
Sunday, June 15, 2008
Nice site on "walkability"
Apologies for the lack of posting recently ... a combination of being heads down on whereyougonnabe together with a couple of other projects, plus fitting in some vacation time over in Europe (I highly recommend visiting Porto). We will have a significant upgrade to whereyougonnabe coming very shortly, but I'll save that for another post.
But in the mean time, I noticed this post from Paul Ramsey on how glad he was to live in a walkable neighborhood, which reminded me of a nice site called Walk Score which I've been meaning to post about. It ranks where you live based on the amenities you can walk to (based on the Google Local Search API), and like Paul I'm glad to report that I am in a good spot - my loft in downtown Denver scores 95 points out of 100.
The site seems to have reasonable international coverage too - I tried it for a few locations I know in Canada and the UK, and it gave good results for both. They even kindly provide results for various "celebrity locations" - Bill Gates' home only scores 11 out of 100, for example, while President Bush's ranch in Texas scores 0! Anyway, I thought it was a nicely done and interesting site.
Monday, May 5, 2008
New release of whereyougonnabe
Well, we've been busy in the three weeks since we released our first beta of whereyougonnabe, and today we put out some significant improvements, including support for the Safari web browser, email notification when we find close interactions with your friends, a cool Facebook profile widget, the ability to easily re-use previous locations, and a number of other usability improvements and bug fixes.
This is what the new profile widget looks like:
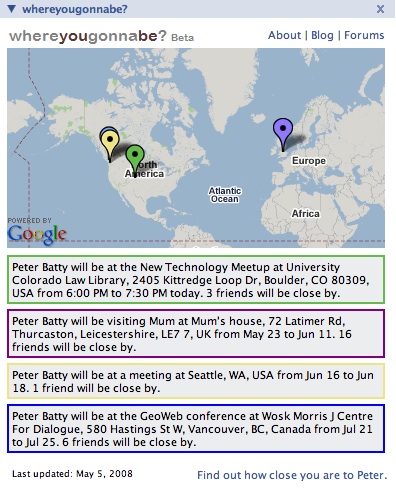
A major focus for us is making it very easy to create activities, and we have added the ability to dynamically select previously created locations. This is a screen shot showing how this looks on the create activity screen:
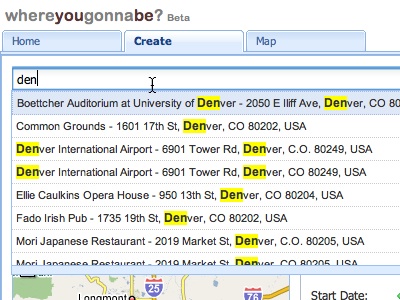
We also took some of Stefan's comments to heart, and have made the activity title optional, so you can just say "Peter will be in Boulder" rather than "Peter will be working in Boulder". As well as giving you more flexibility this makes it faster to create activities, as the minimal things you need to specify now are a location, plus start date and end date (which both default to today) - but you have options to enter various other details if you want to. We also fixed an issue with handling accented characters, and made some improvements to our icons, fixing some aspect ratio issues and adding a default icon for people who don't have a picture on Facebook.
We will now email you when we find that you are going to be close to some of your friends, which is just the first step in providing a range of notification capabilities.
We have a lot more things in the pipeline, including further Facebook integration (support for the newsfeed and minifeed coming very soon, plus the ability to set your Facebook status when an activity starts), our first steps in calendar integration, and a simplified interface suitable for mobile browsers.
If you haven't signed up yet or you want to check out the new features, you can do so here. And we welcome your feedback on our new forums (or feel free to email me).
This is what the new profile widget looks like:
A major focus for us is making it very easy to create activities, and we have added the ability to dynamically select previously created locations. This is a screen shot showing how this looks on the create activity screen:
We also took some of Stefan's comments to heart, and have made the activity title optional, so you can just say "Peter will be in Boulder" rather than "Peter will be working in Boulder". As well as giving you more flexibility this makes it faster to create activities, as the minimal things you need to specify now are a location, plus start date and end date (which both default to today) - but you have options to enter various other details if you want to. We also fixed an issue with handling accented characters, and made some improvements to our icons, fixing some aspect ratio issues and adding a default icon for people who don't have a picture on Facebook.
We will now email you when we find that you are going to be close to some of your friends, which is just the first step in providing a range of notification capabilities.
We have a lot more things in the pipeline, including further Facebook integration (support for the newsfeed and minifeed coming very soon, plus the ability to set your Facebook status when an activity starts), our first steps in calendar integration, and a simplified interface suitable for mobile browsers.
If you haven't signed up yet or you want to check out the new features, you can do so here. And we welcome your feedback on our new forums (or feel free to email me).
Subscribe to:
Posts (Atom)